PVM Analysis (as I like to refer to) breaks down sales by its drivers - price and volume - and measures the effect that each had in changing sales from period X to period Y. Let’s say that we are in August 2022 and a restaurant wants to understand why its sales declined compared to August 2021. One way to go about it would be analyze if customers are spending on cheaper meals or if customers are not coming anymore. In other words, sales = average spending per customer x number of customers
PVM analysis can be understood geometrically, like this:
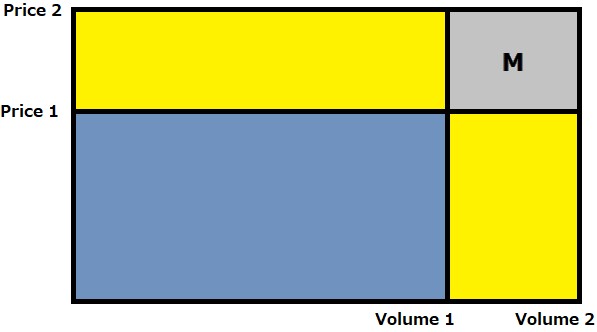
The difference between areas of Price 2 x Volume 2 and Price 1 x Volume 1 is the difference in sales from period 1 and period 2. The yellow squares show the changes that drivers had toward overall sales. The “M” in PVM stands for “Mix”. I believe that most versions of the PVM Analysis like to add a “Mix” effect that represents the portion of change in sales that are not solely exaplained by prices or volume. For simplicity, I just assume that the area occupied by “Mix” belongs to price. You could assign it to volume; it’s just an assumption.
So, I modified the PVM analysis a little bit to accommodate a situation in which sales should be broken down into 3 drivers. Here’s the business situation.
The Business Situation. “Desafinado Karaoke Lounge”** is a fake chain of karaoke boxes that operates in 10 different locations in Japan. Karaoke boxes in Japan usually requires that users register for a member card that allows the company to keep track of their metrics in exchange for perks and rewards. We could divide sales into the following drivers:
- Average Price Spent per Member
- Average Numbers of Visit by the Member
- Number of Members
Desafinado wants to understand why some locations do not perform as well as others. Should it encourage more membership? Or should it start a campaign to get inactive users back? Or should they try to get customers to buy higher value snacks and drinks? For this case, we need to imagine the volume of a cube instead of the area of a square.
So, I built a dummy data for our fake company and proceeded to calculate the difference in volume from one period to the other. I think there are a couple of different ways that we could calculate it. Here is the notebook if you are interested in the calculation details.
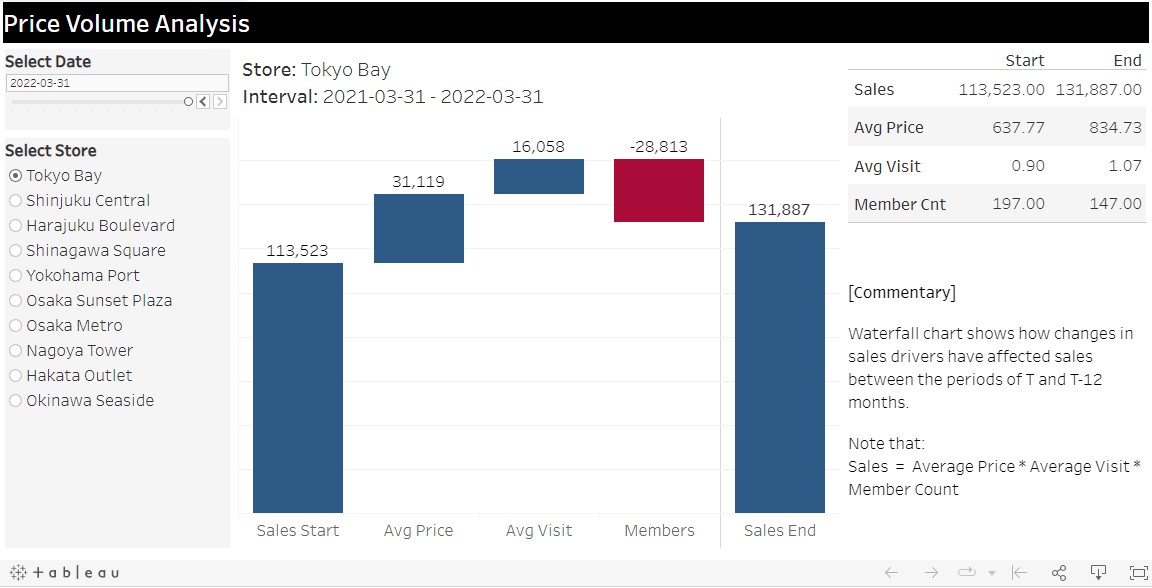
I uploaded the results of this three parameter version of the PVM analysis in Tableau Public. Here’s an image sample of the output.